New and Additional Studies
This appendix describes further short studies beyond those presented in the original CRUX manuscript that highlights other functions of CRUX
- Original CRUX manuscript:
CRUX, a platform for visualising, exploring and analysing cancer genome cohort data, by El-Kamand et al.
Identifying key copy number variants (CNVs) in a tumour cohort dataset
Rationale: Somatic CNVs are a hallmark of many tumours, driving large-scale numerical differences in DNA, resulting in alterations to gene dosage and expression. GISTIC2 is a well-established tool for assessing the CNV landscape of a cancer cohort, identifying genomic regions harbouring recurrently amplified and deleted genes. CRUX can use GISTIC2 processed data (which are publicly available for TCGA datasets) to visualise CNV and add clinical detail annotations for further interactive explorations. To keep CRUX lightweight and easy to install, CRUX does not run GISTIC2 itself, and instead offers pre-compiled GISTIC2 data for TCGA cohorts. For researchers wishing to generate GISTIC2 results on their cohort, we recommend using GenePattern (available online at www.genepattern.org).
Dataset: Inbuilt TCGA GISTIC2 results for both GBM (n = 273 with matched WGS) and breast carcinoma (n=960 with matched WGS) were used.
Analysis and Observations: Here, the TCGA GISTIC2 data was imported into CRUX, then the GISTIC-Plot module was used to create tabulated summaries and data visualisations highlighting potentially important CNVs (Supplementary Fig. S1A). The chromplot visualisation (Supplementary Fig. S1B) revealed the highest G-Score peak, a measure of CNV amplitude and recurrence, which corresponded to EGFR amplification in GBM; the second strongest CNV signal was a deletion in the CDKN2A-containing 9p21 region. Four other smaller peaks were noted with G-scores between +0.5 and +2. An analysis of the TCGA breast carcinoma cohort CNV data showed strong signals of HER2 / ERBB2 amplification, well described in breast carcinoma (Supplementary Fig. S1C).
Outcomes: CRUX visualised several CNV events that are known drivers of cancer development, including CNVs affecting EGFR in GBM and ERBB2 (HER2) in breast cancers.
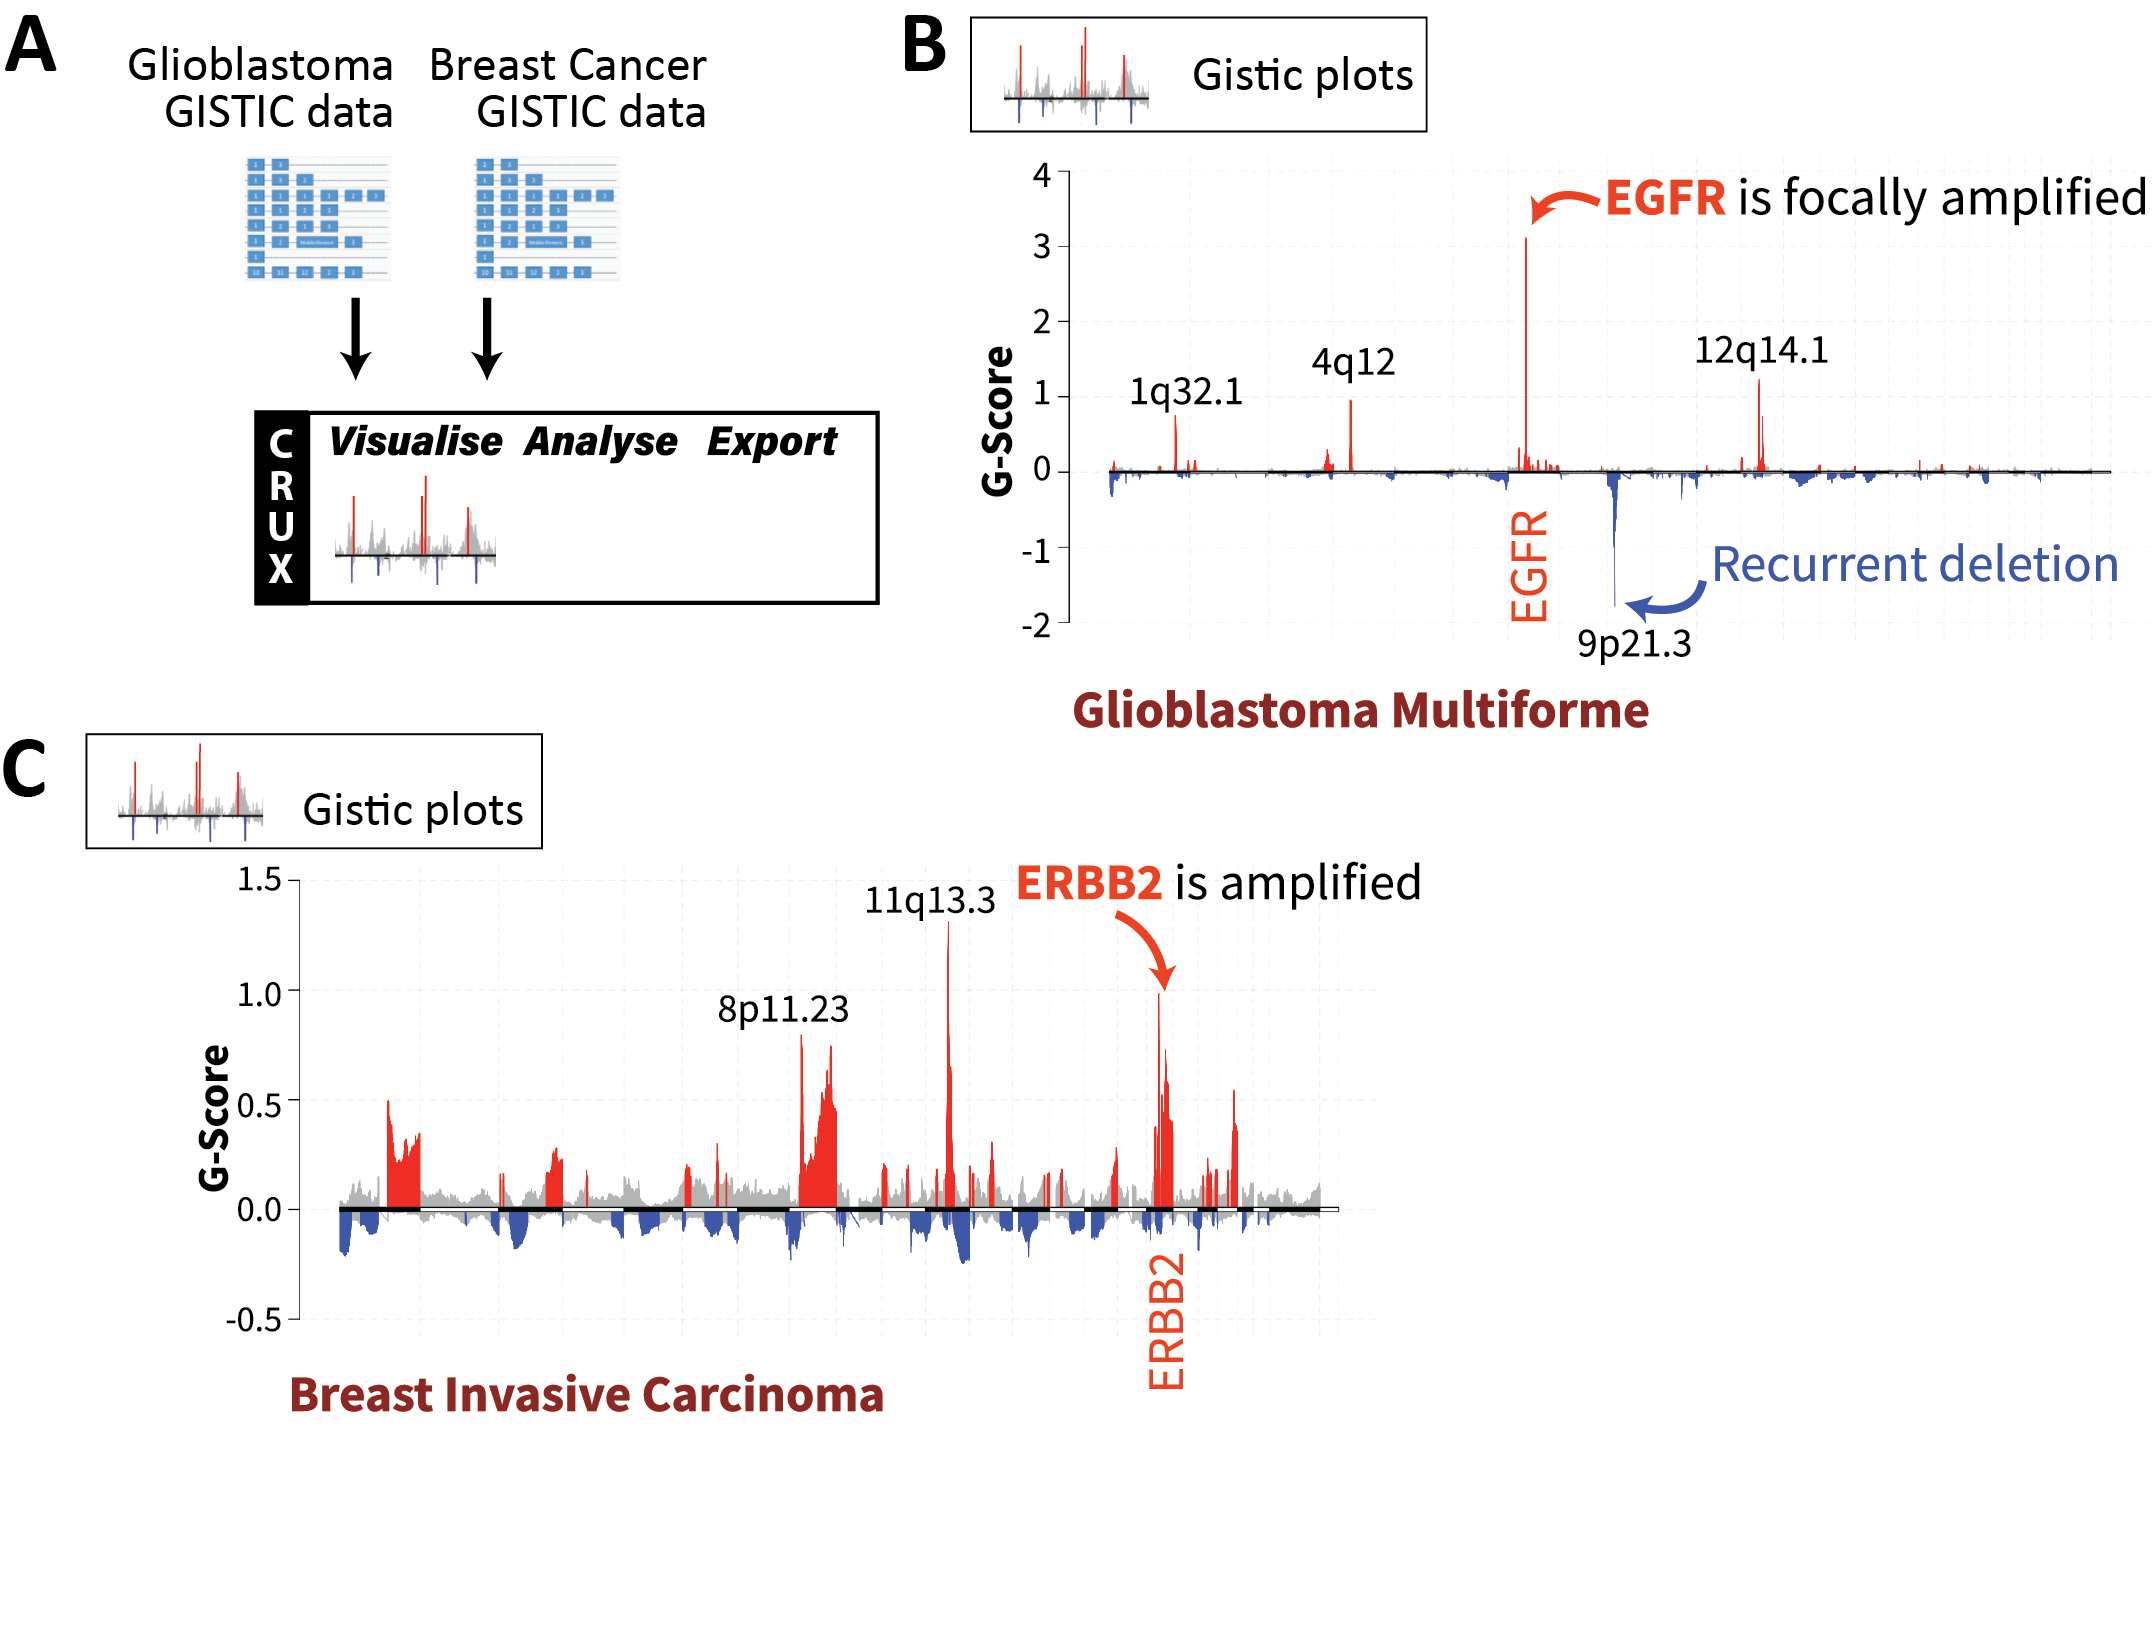
Figure S1. Cohort-level visualisation of copy number alterations from GISTIC2 results using CRUX. (A) Integration of CNV data from TCGA glioblastoma (GBM) and TCGA breast carcinoma (BRCA). Inbuilt GISTIC2 datasets for the TCGA GBM and BRCA cohorts were selected, leading to automatic generation of ‘chromplot’ visualisations. These are plots of the G-Scores (a metric integrating CNV recurrence and amplitude) which indicate the likely importance of CNVs in a cohort. (B) Selecting the GBM cohort in CRUX produced visualisations showing peaks corresponding to the characteristic EGFR amplification. (C) Visualisation of invasive breast carcinoma CNV data reveals peaks that notably correspond to HER2 / ERBB2 as well as 11q13.3 amplification, which contains driver genes such as CCND1 and EMS1.